A Rosetta Stone for AI Benchmarks
Epoch AI Rosetta Stone for AI benchmarks
combining benchmarks to get a single score of benchmark difficulty and model capability. As part of their motivation, they use this as a way to compare models from very different times, where some models might have saturated a benchmark and some other models may be too dumb for that benchmark. That’s unfortunately a limitation of our benchmark-specific approach, but I think it’s fine because we don’t really care about really dumb models, we only care about the frontier and what’s next.
we share their approach’s advantage of not having to crowdsource data → being super cheap 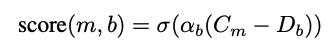
- they do something IRT esque, except they’re predicting continuous performance directly from the sigmoid, instead of using binary 0/1 response data
C_m is still model capability, D_b is still benchmark difficulty
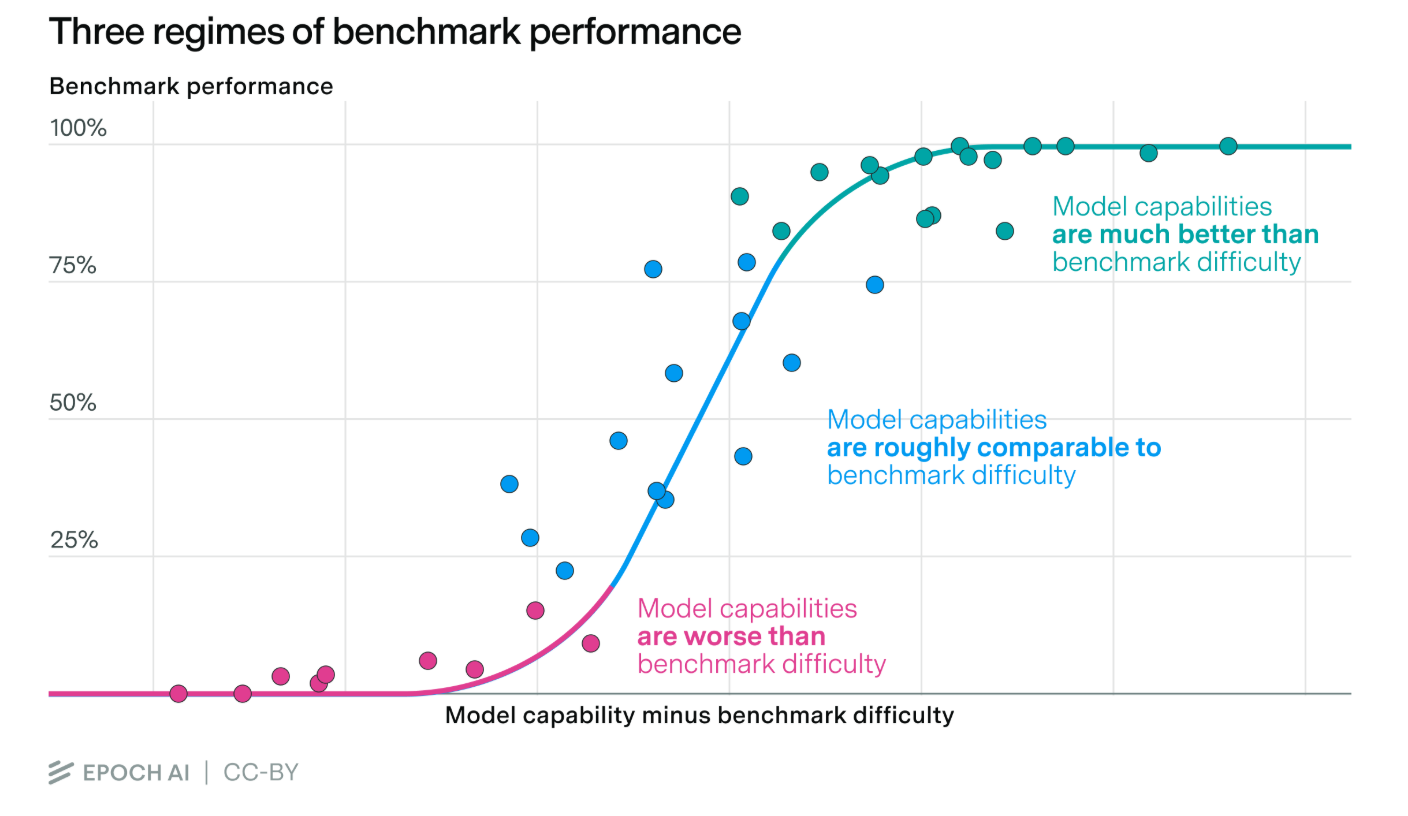
- they justify the sigmoid model because qualitatively benchmark performance looks like this
-
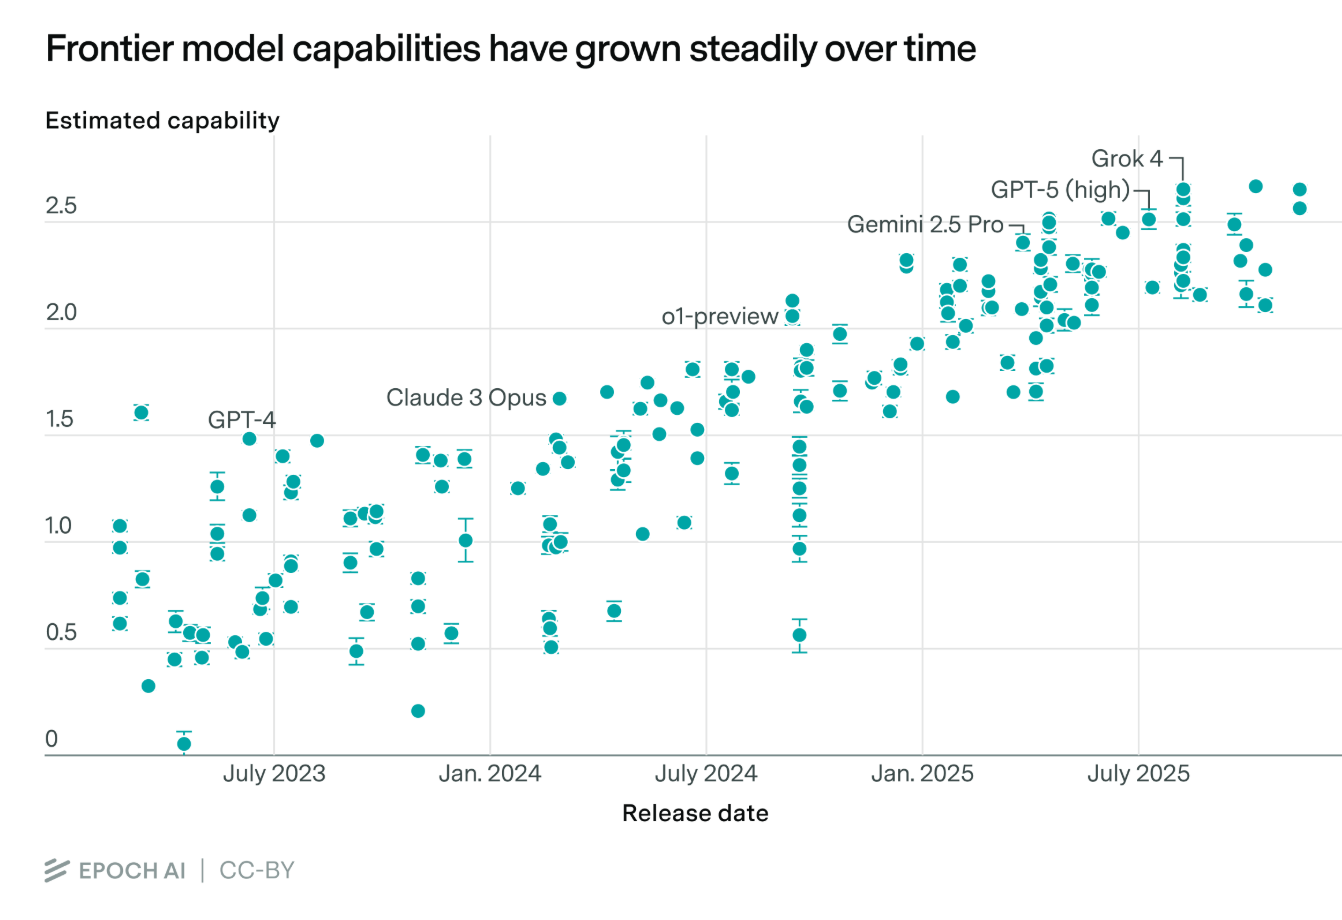
This is their version of the fit, plotting estimated general capability across benchmarks over release date of the model
- they show (Figure 6) that if they had instead chosen to run the linear regression of the fit over time right before the introduction of reasoning models, it would have underestimated the curve of frontier models, which feels pretty reasonable and fair
- Figure 7 they do the same plot except with compute on the x axis. This also doesn’t seem that interesting for us, like time seems much cooler
- they have some really sketchy metrics that they don’t seem to like very much for estimating algorithmic development using the y intercept of this plot of capability vs log compute (table 2)
To validate their data on model capabilities, they also fit a linear regression of model capability against the METR predicted time horizon of tasks that the model can solve, and find Test R^2 = 0.753 which is ok I guess 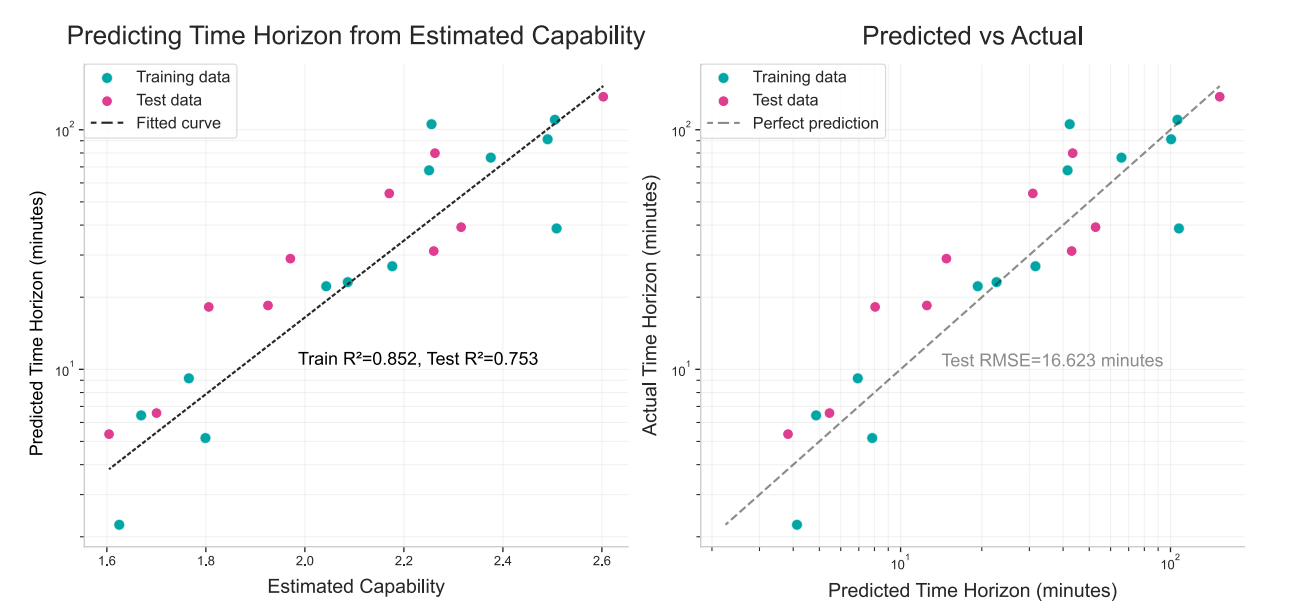
- they tried running the regression using just one benchmark at a time for the model capability fit, and found that the median R^2 was 0.62 which is worse
- some individual benchmarks did better, but they all had at most 13 models overlapping with METR, so it was probably just noise
They use their capability and difficulty scores to predict model performance on specific benchmarks. They point out the anomalies where their predictions are very off, and notice that the residuals have patterns. This is highly related to this other post https://epochai.substack.com/p/benchmark-scores-general-capability, which concludes that there is a second direction of model capability, which is “Claudiness” (how good is the model at Code and bad at everything else) 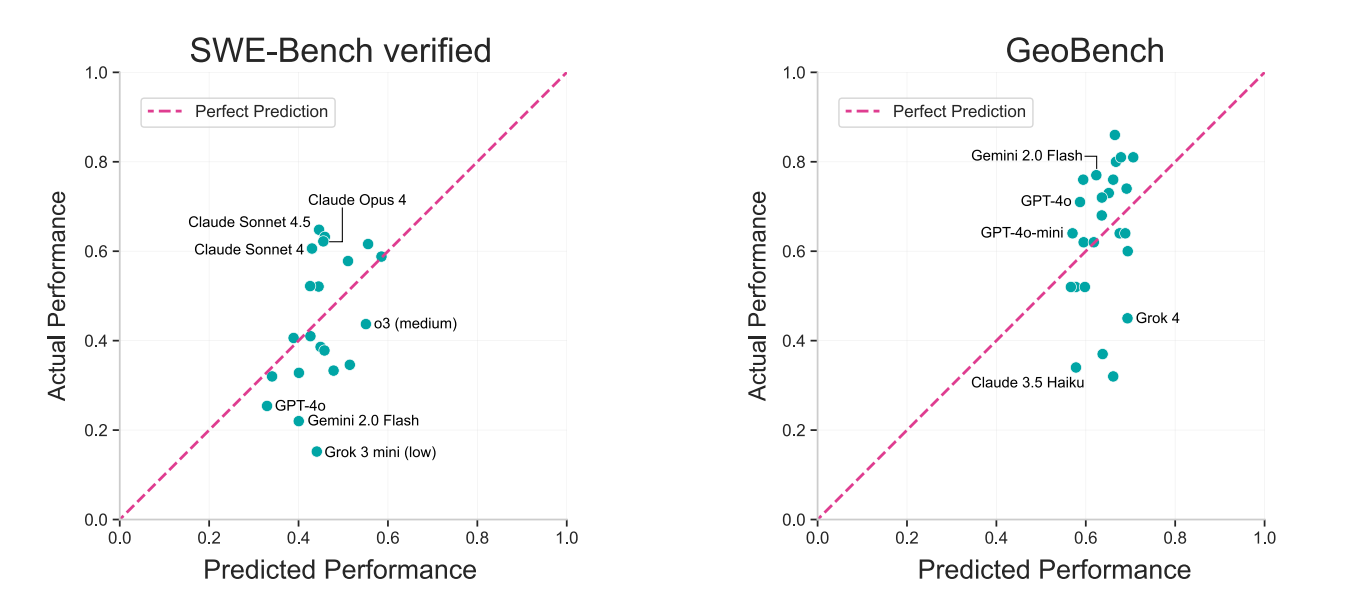
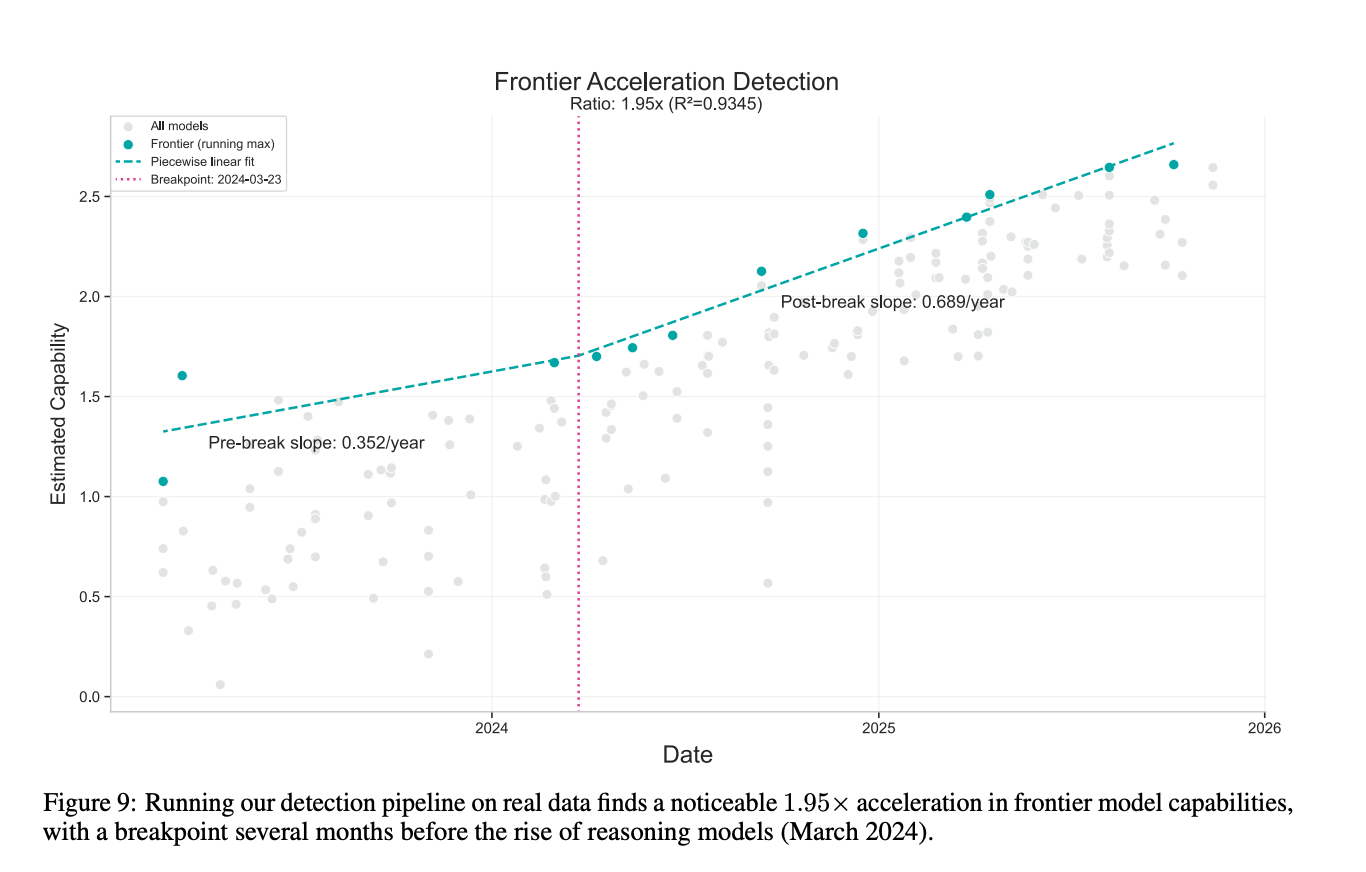 their last experiment is basically looking for a change in the slope of capability over time, which they call an acceleration. They don’t find anything significant (their bar is 2x), but what they did find is somewhat consistent with the METR finding that the doubling time would shorten if you started at 2024